Previously, I wrote about what a trading system is and why you really need (a good) one to succeed in BTC trading.
I’d like to say that this is the grand reveal, but…it’s more of just a reveal. Or perhaps further context if you will.
Anyway, this article breaks down what my actual System is, how I use it and the thinking behind it. It is probably as close to a ‘manual’ or ‘how-to’ guide as it gets (for now).
It’s not perfect. But it’s got enough behind it for me to trade, refine, and I guess, build a website out of?
Here we go:
The System environment
The System, as is currently configured, is designed to work in the following environment:
| Variable | Value |
|---|---|
| Market | BTC/USDT perpetual futures (’perps’) |
| Timeframe | 15-minute |
| Key Sessions | Primarily London/New York overlap and New York session |
| Market Structure | Defined range |
The Foundations
Before I jump into how the individual setups work, you need to understand why key level and volume are so important, because without both of these, there is no trade setup.
Key level: A clear price boundary where a reaction is likely. It is essentially a support or resistance level on the 15-minute timeframe. These levels shouldn’t be difficult to find or questionable. A simple litmus test: if you’re unsure whether something is a key level, it isn’t.
Volume: How much trading activity is taking place. Meaningful volume is necessary because it indicates both interest and conviction in a move. Lots of participation is good because price movements need to be convincing and have momentum.
How key levels and volume interact
Key levels attract attention, with many other market participants looking to trade around them.
As price reaches the level, volume increases as buyers and sellers do their thing. Eventually, one side overwhelms the other through more aggressive trading.
Price then either rejects the key level or breaks through and holds beyond it and that’s where the System’s two setups kick in.
The Setups
The System is driven by two setups:
Mean Reversion
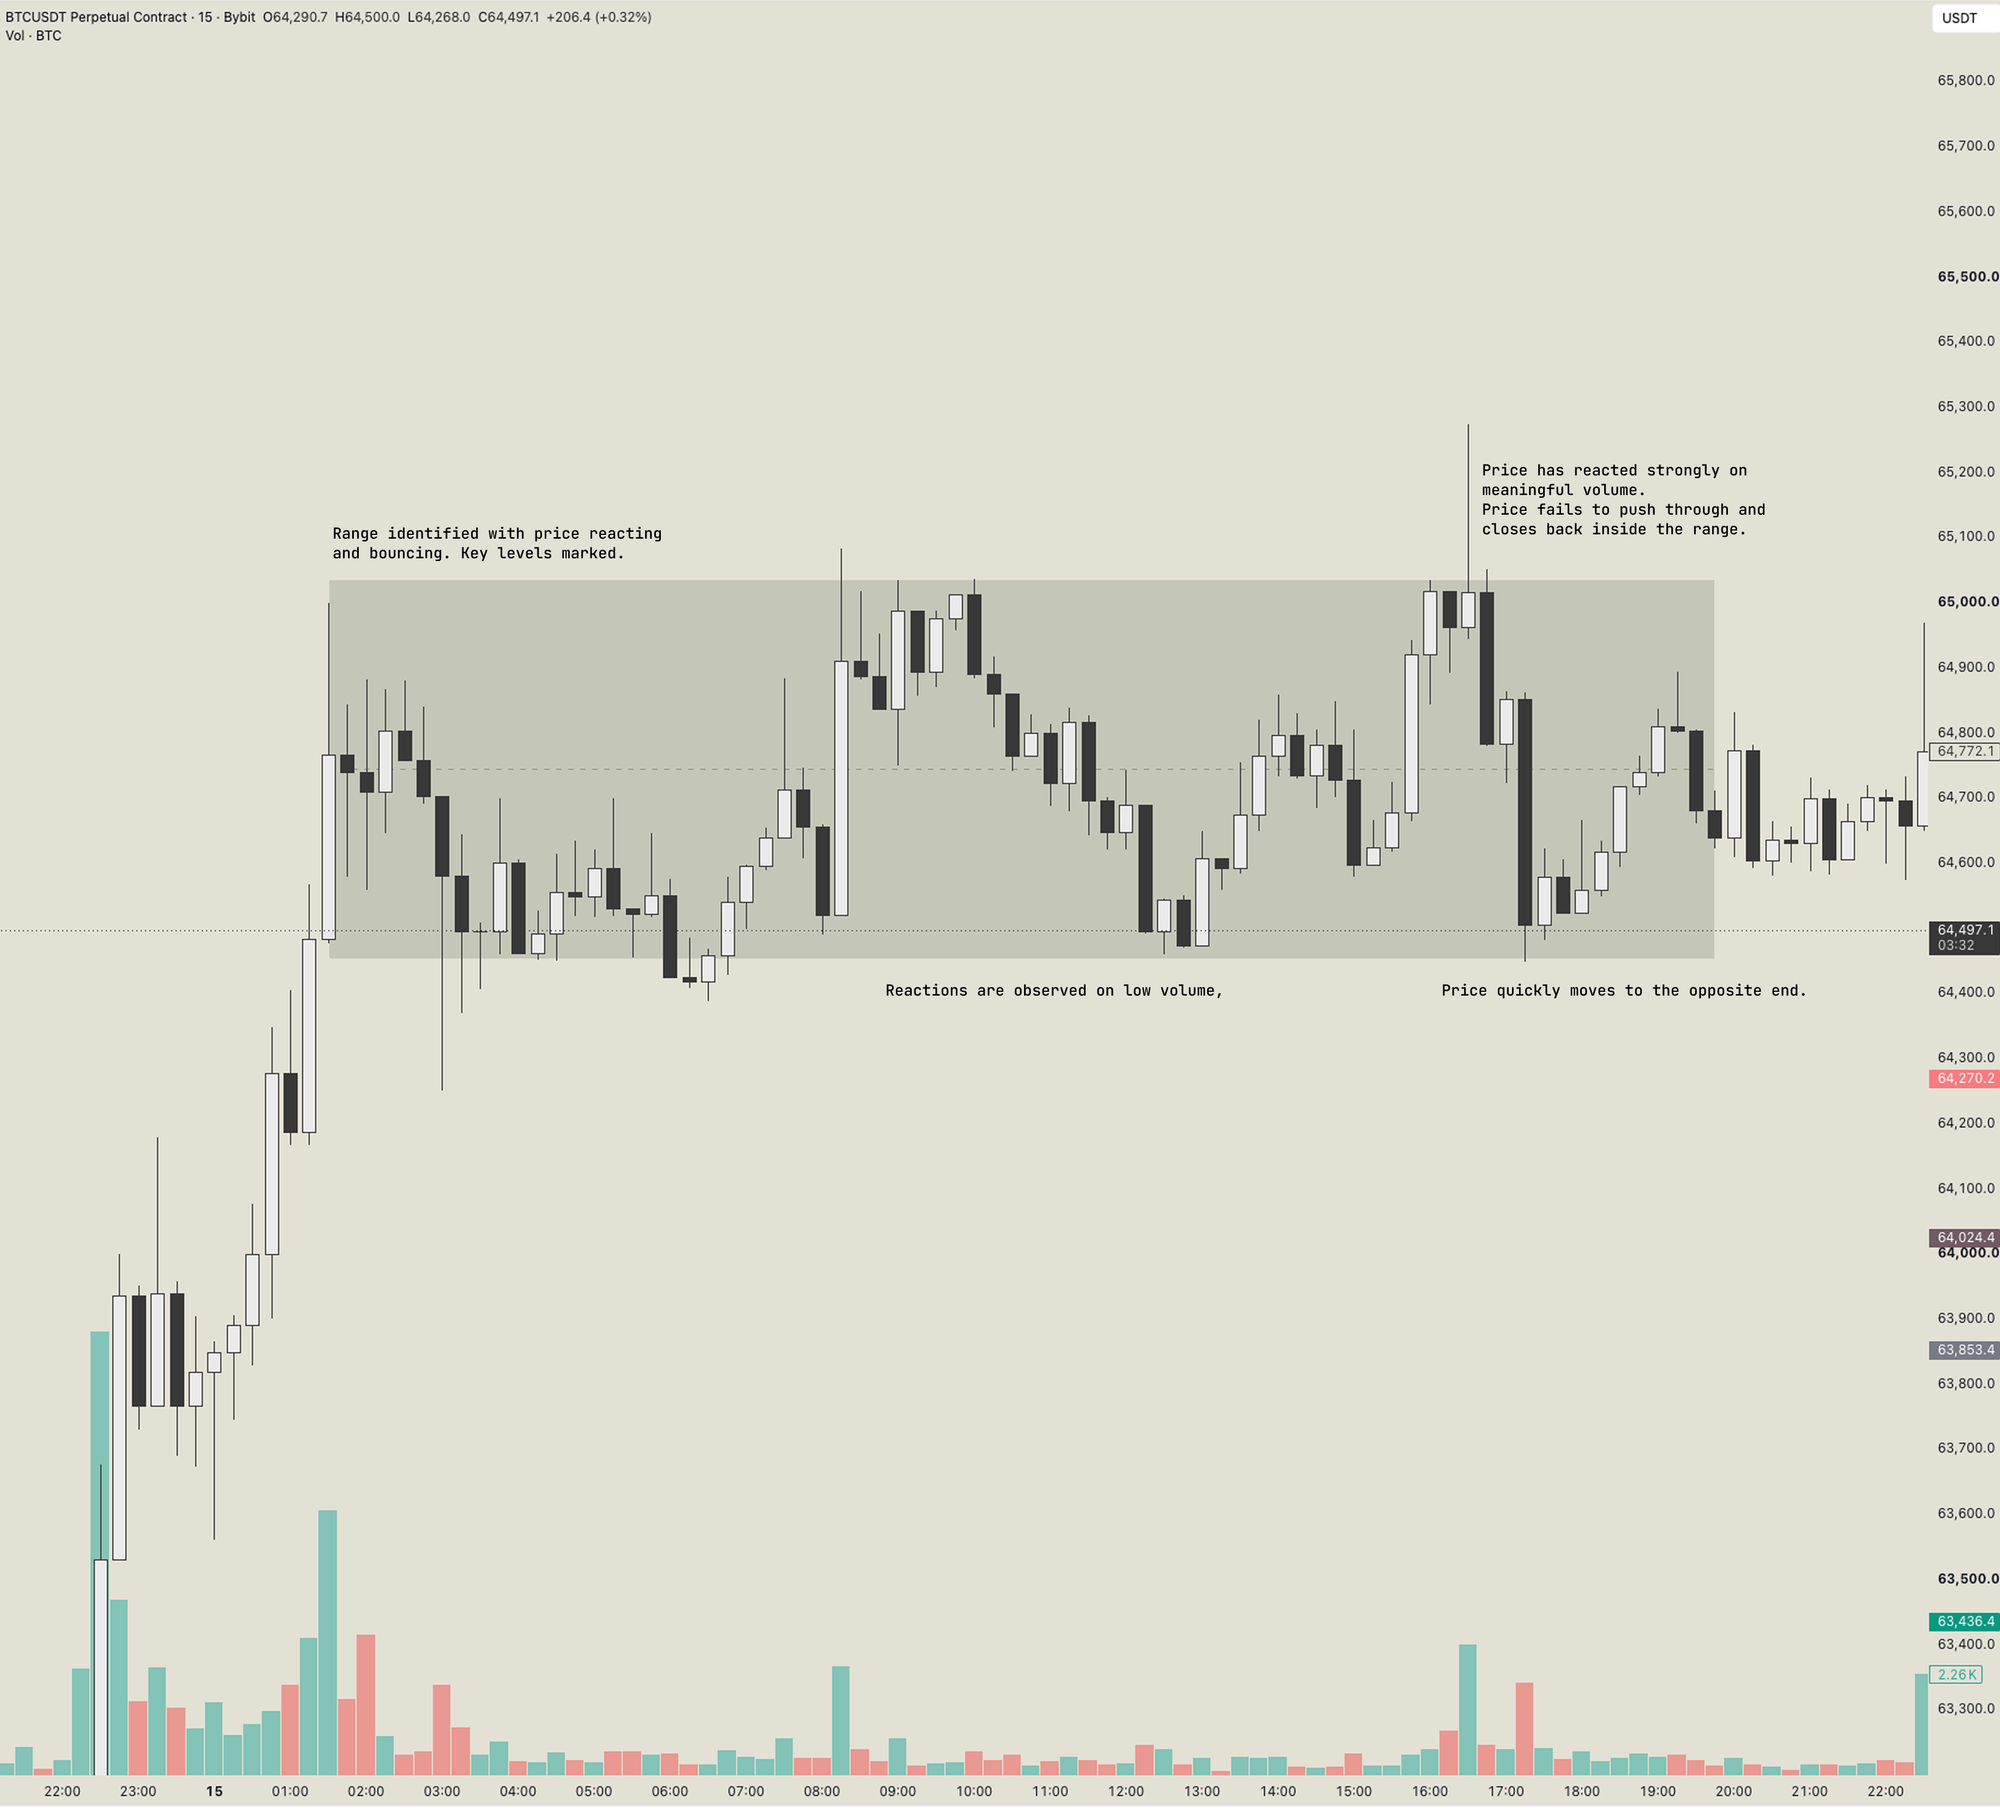
The Mean Reversion setup is simple in theory and is essentially your typical support and resistance trade.
BTC is trading within a range, ping-ponging between two key levels. Eventually, price attempts to break through one of these levels but is rejected.
After being rejected, where does price go? Simple: back towards the middle of the range or its mean.
In this setup, I try to capture a move to the opposite end of the range targeting +1.5R.
Breakout
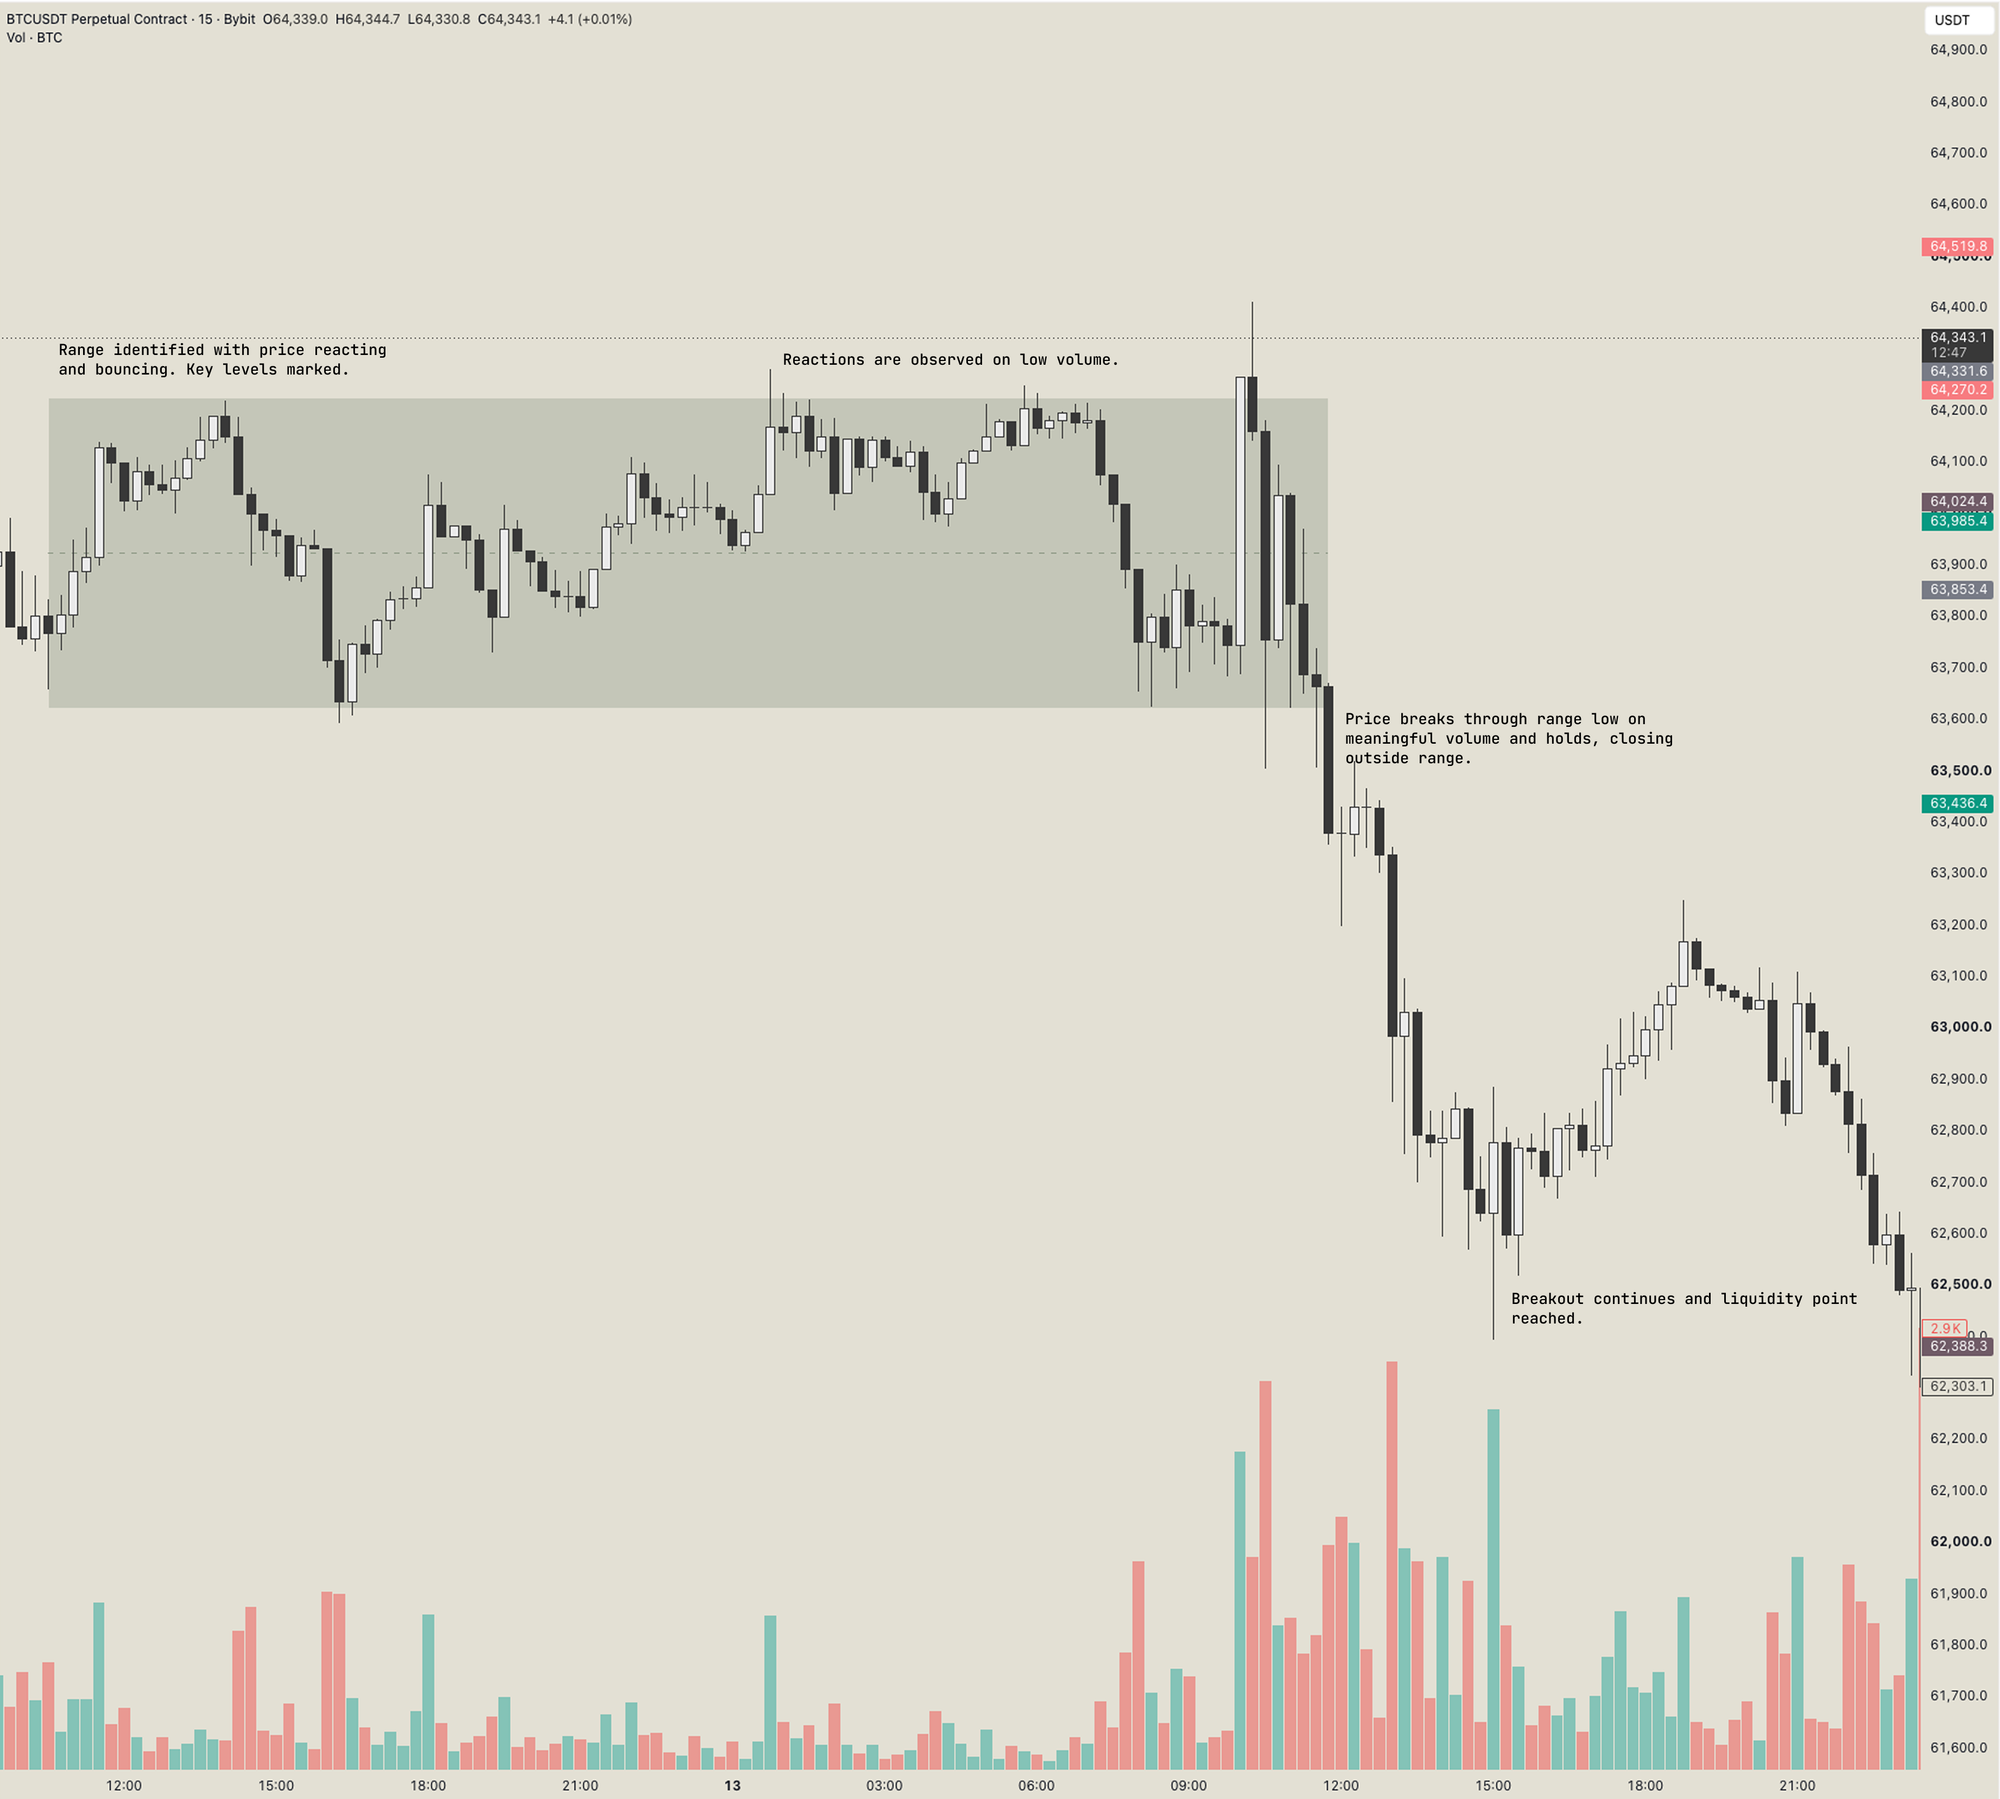
The Breakout setup begins in much the same way, but looks for the opposite outcome.
BTC is trading within a range before price reaches a key level and pushes through it successfully. Not only does it push through, but price holds beyond the level and continues moving away from the range.
So where does price go? That’s a bit harder to answer, but generally towards the next significant liquidity zone,
The setup looks to capture the breakout to the next liquidity zone for +2.0R.
Anatomy Of A Trade (or: How I Take a Trade)
I mentioned in this article that the System is basically an extended decision tree and series of questions I ask myself to determine if a trade should be taken and how to configure it.
Let’s go through it now:
Trade Qualification
These are the most basic questions used to assess if a position should be opened or if a trade should be taken at all.
These rules are the strictest, so your answers need to be a confident yes to proceed. Any hesitation or uncertainty means there is no trade.
| Question | Answer |
|---|---|
| Is price at a key level? | Yes → Proceed No → No trade |
| Is there meaningful volume? | Yes → Proceed No → No trade |
| Are we clear of NY open | Yes → Proceed No → No trade |
| Are we clear of upcoming economic announcements or results? | Yes → Proceed No → No trade |
Timing
Timing is important when trading BTC on lower time frames because the System needs additional data that only time can reveal.
A lot can happen in the final minute of any candle, so be patient.
| Question | Answer |
|---|---|
| Has the key candle closed? |
Yes → Proceed No → Wait |
| Where did the key candle close? |
Inside range → Mean reversion setup forming Outside range → Breakout setup forming |
Order flow
Order flow is an entire subject in itself. I won’t attempt to explain all of it here.
The general idea is to see where buying and selling took place in order to determine which side was more aggressive in moving price, if they were successful and if continuation is likely.
You need special software for this. I use MMT and Exocharts.
| Data | Observation |
|---|---|
| Delta | Which side is more aggressive and by how much? |
| Open Interest | Is positioning being added or removed as price moves? |
| Liquidations | Are traders forced out of their positions and in what size? |
Size, Entry, Exit, Target
So you’ve picked your setup and the data is there. Great. Now you need to configure the actual trade parameters.
From here, you need to be working and thinking very fast, especially during the London/New York overlap.
The key thing here is ensure that what you are chasing is worth it. You need to know how much you stand to gain by winning and what that could cost if you lose.
| Question | Answer |
|---|---|
| Do you have a clear entry price or range? |
Yes → Proceed No → No trade |
| Do you have a clear invalidation (stop loss price)? |
Yes → Proceed No → No trade |
| Do you have a clear profit target? |
Yes → Proceed No → No trade |
| Is the profit target enough? |
Mean Reversion → +1.5R Breakout → +2.0R If No → No Trade |
Management and Exit
This is a more complex part of the System that I’ll need to revisit, or perhaps cover in a separate article. But basically, it comes down to deciding when to exit. I believe for most people, this is the hardest.
In best (and simplest) case, price reaches the original profit target and that’s it. Trade over. So far, however, that has rarely happened.
The System remains a work in progress, and trade management is currently its weakest area—or, perhaps more positively, the area with the greatest opportunity for improvement.
| Question | Answer |
|---|---|
| Is price within 0.1R of the target? |
Yes → Close trade No → Continue following the plan |
| Has price hit a liquidity zone? |
Yes → Only remain in the trade if there is clear evidence supporting continuation No → Continue following the plan |
| Is evidence supporting a trade deteriorating? | Yes → Close the trade |
The System In Progress
To wrap this article up, TRADING#NUMBERS is about documenting, testing and refining the System right in front of you. The foundations are now in place, but individual rules—particularly around trade management—are still being improved.
There is still a lot of nuance behind what might appear to be fairly simple checklists. And the whole point for me is to reduce as much of this ambiguity as possible. There is already enough randomness in the market as is.
Changes and fixes are documented through System patches, while The Journal records the trades, numbers and lessons behind them.
The first proper evaluation will come after 100 trades. Until then, it's all about keeping it simple. Follow the System, keep collecting data and see that the numbers say.
Member comments